Next: Inverse of a Gaussian Up: Miscellaneous notes Previous: October – Fast Fourier Contents
Let's construct a simple digital band-pass filter based in the sinc filter.
As everyone know, the sinc function is the impulse response
of a low-pass filter. That is, the convolution
of a signal  and the sinc function
 will produce a low-pass filtered signal without frequencies higher than
  . Similarly, the function
 where
where  represents the Dirac delta function, is the frequency response of the ideal high-pass filter of frequency
  .
.
Heuristically, we can right away derive the discrete versions of the impulse responses:

![$\displaystyle i \mapsto \delta[i] - \frac{\sin(2 \pi \frac{B_H}{f_c} i)}{\pi i},
$](img96.svg)
for the high-pass filter. The variable  is the sampling frequency and
![$i \mapsto \delta[i] := \delta_{0i} $](img97.svg) is the Kronecker delta.
is the Kronecker delta.
Now, having a discrete signal at hand, band-pass filtering is (in the simplest approach) just a matter of discrete convolution of the signal with the functions above. The following Octave code does the job.
##Sinc band-pass filter. f0 = B_L/fs, f1 = B_H/fs
function filtered = sincfilter(signal, f0, f1)
if(mod(length(signal), 2) != 0) #Check if the signal length is even or odd.
signal = signal(1 : length(signal) - 1);
end
M = 10000; #Increase this to increase accuracy.
sincF = zeros(1, M);
for m = -M/2 + 1 : 1 : M/2
if(!(m == 0))
sincF(m + M/2) = sin(2*pi*f1*m)./(pi*m);
else
sincF(m + M/2) = 2*f1;
end
end
sincH = zeros(1,M);
for m = -M/2 + 1 : 1 : M/2
if(!(m == 0))
sincH(m + M/2) = -sin(2*pi*f0*m)./(pi*m);
else
sincH(m + M/2) = -2*f0 + 1;
end
end
##Plot stuff.
figure(1)
plot(sincF)
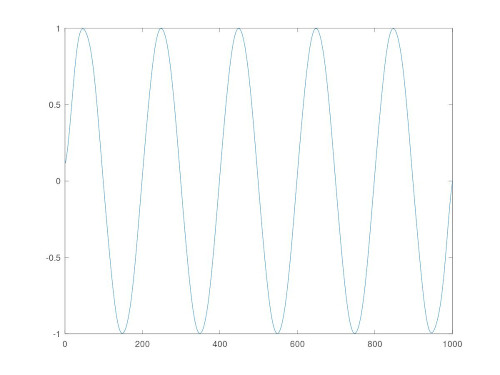
figure(2)
plot(signal)
tic
filtered = conv(signal, sincF, "same");
filtered = conv(filtered, sincH, "same");
toc
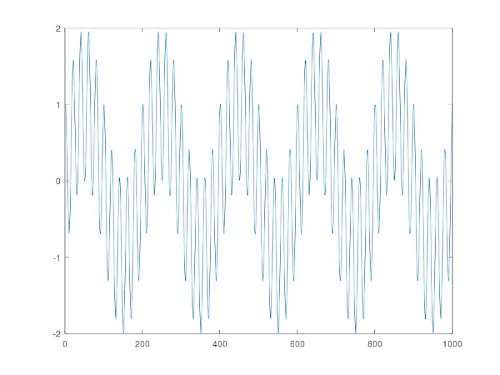
figure(3)
plot(filtered)
end
For more accuracy and effectiveness, one should use windowed or recursive filters. One can check in the references for more sophisticated methods!
References: