Next: March Signal propagation in Up: Blog posts 2021 Previous: Blog posts 2021 Contents
The Poisson point process
can be generalized to general manifolds. In Particular, the Poisson process on a three-dimensional sphere surface is useful. Nicely enough, the Poisson process on a unit sphere is equivalent to the process in a two-dimensional area
![$A = [-\pi,\pi] \times [-1,1]$](img76.svg) through the area-preserving mapping from
through the area-preserving mapping from  to geographical coordinates
 |
(1) |
The resulting process interpreted in geographical coordinates
 is a Poisson point process on a sphere of radius
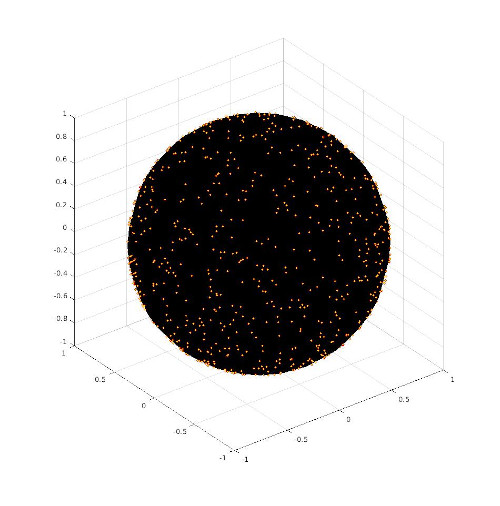
  . The following code returns a scatter plot of Poisson points on the unit sphere.
GNU Octave or Matlab:
%Plot random points on a unit sphere. Returns the points in a vector ref in cartesian coordinates
function refc = poissononsphere(density)
  yMin = -1; yMax = 1;
  xMin = -pi; xMax = pi;

  xDelta = xMax - xMin; yDelta = yMax - yMin; %Rectangle dimensions
  numbPoints = poissrnd(density);    %Number of points in the area is a Poisson variable of intensity given as density
  x = xDelta*(rand(numbPoints,1)) + xMin;    %Pick points from uniform distribution
  y = yDelta*(rand(numbPoints,1)) + yMin;    %Map referencepoints to geographical coordinates

  refs = [x'; asin(y)'];%Map geographical coordinates to Cartesian coordinates on a unit circle
  r = 1;
  refc = [r*sin(refs(2,:)+pi/2).*cos(refs(1,:)+pi);...
          r*sin(refs(2,:)+pi/2).*sin(refs(1,:)+pi);...
          r*cos(refs(2,:)+pi/2)];

  figure(1)    %Plot
  [X, Y, Z] = sphere;
  surf(X,Y,Z,'EdgeColor','none','FaceColor','black');
  hold on
  scatter3(refc(1,:),refc(2,:),refc(3,:),10,...
           'MarkerFaceColor','yellow',...
           'MarkerEdgeColor','red');
  axis equal
end
Python:
import numpy as np
import scipy.stats
import matplotlib.pyplot as plt
from mpl_toolkits.mplot3d import axes3d

#Rectangle dimension
xMin = -np.pi; xMax = np.pi;
yMin = -1; yMax = 1;
xDelta = xMax - xMin; yDelta = yMax - yMin; #rectangle dimensions

#Density parameter of the Poisson point process. Mean number of points on the sphere
lambda0=1000;

#Simulate Poisson point process

#Number of point in the area is a Poisson variable of intensity lambda0
numbPoints = scipy.stats.poisson( lambda0 ).rvs()
x = xDelta*scipy.stats.uniform.rvs(0,1,((numbPoints,1)))+xMin
y = yDelta*scipy.stats.uniform.rvs(0,1,((numbPoints,1)))+yMin

#Transform to geographical coordinates
x = x
y = np.arcsin(y)
#Plotting
fig = plt.figure()
ax = plt.axes(projection="3d")
ax.scatter(np.sin(y+np.pi/2)*np.cos(x+np.pi),np.sin(y+np.pi/2)*np.sin(x+np.pi),np.cos(y+np.pi/2), color='r' )
plt.show()
Wolfram Language:
(*lambda is the mean number of points on the unit sphere*)
  poissononsphere[lambda_] :=
  Module[{nrofpoints, phi, theta, radius, refc, polarp},
   nrofpoints = RandomVariate[PoissonDistribution[lambda]];
   polarp =
    Table[{RandomVariate[UniformDistribution[{-Pi, Pi}]],
      ArcSin[RandomVariate[UniformDistribution[{-1, 1}]]]},
     nrofpoints];
   radius = 1;
   refc =
    Table[{radius*Sin[polarp[[i]][[2]] + Pi/2]*
       Cos[polarp[[i]][[1]] + Pi],
      radius*Sin[polarp[[i]][[2]] + Pi/2]*Sin[polarp[[i]][[1]] + Pi],
      radius*Cos[polarp[[i]][[2]] + Pi/2]}, {i, nrofpoints}];
   refc
   ];
   ListPointPlot3D[poissononsphere[500], BoxRatios -> {1, 1, 1}]
 |
References: